Tag Archives: Government debt

“Die Schattenseiten von Schuldenbremsen (The Dark Side of Debt Limits),” ifoSD, 2021

ifo Schnelldienst 4/2021, April 14, 2021. PDF.

Was Schuldengrenzen aus politökonomischer Sicht besonders attraktiv erscheinen lässt – ihre vermeintliche Einfachheit und Klarheit – birgt also auch Risiken. Es führt dazu, dass Politiker und ihre Wähler die Solidität der Staatsfinanzen über Gebühr an expliziten Bruttoschulden messen. Was aber zählt, wenn es um unerwünschte Umverteilung zulasten künftiger Generationen geht, ist staatliches Nettovermögen in einer umfassenden Gesamtschau.

“Staatsschulden sind keineswegs kostenlos (Free Government Debt?),” NZZ, 2021

NZZ, February 1, 2021. PDF (title changed by NZZ). Related article in Ökonomenstimme. HTML.

Do negative interest rates render government debt costless? No. What about r<g? I discuss Olivier Blanchard’s presidential address and the conclusions that columnists have drawn.

For background: See this post.

“Financial Policy,” CEPR, 2018

CEPR Discussion Paper 12755, February 2018. PDF. (Personal copy.)

This paper reviews theoretical results on financial policy. We use basic accounting identities to illustrate relations between gross assets and liabilities, net debt positions and the appropriation of (primary) budget surplus funds. We then discuss Ramsey policies, answering the question how a committed government may use financial instruments to pursue its objectives. Finally, we discuss additional roles for financial policy that arise as a consequence of political frictions, in particular lack of commitment.

ECB Bond Purchases: Fiscal or Monetary Policy?

In an NBER working paper, Arvind Krishnamurthy, Stefan Nagel, and Annette Vissing-Jorgensen analyze which components of bond yields were affected by the European Central Bank’s government bond purchasing programs.

Given the institutional restrictions on monetary policy in the Euro area, the ECB had to carefully argue why it intervened in the first place. (To many, the case was obvious; the ECB intervention amounted to quasi-fiscal policy. But an intervention with this objective would not be covered by the rules of the Euro area.) It gave two reasons for the SMP, OMT, and LTRO:

The ECB has publicly stated that these policies reduce redenomination risk, i.e., the risk that the Eurozone might break up and countries redenominate domestic debt into new domestic currencies, and financial market “dysfunctionality,” i.e., segmentation- and illiquidity-induced pricing anomalies.

The authors decompose bond yields into five components: an expectations hypothesis component; a euro-rate term premium; a default risk premium; a redenomination risk premium; and a component due to sovereign bond market segmentation. To identify the non-observable, country-specific components (reflecting default risk, redenomination risk, and sovereign bond market segmentation), the authors use information from asset prices that are differentially exposed to these components.

Specifically, they use the fact that

foreign-law sovereign bonds denominated in US dollars cannot be redenominated through domestic law changes … and redenomination into a new currency should affect all securities issued in a given country under the country’s local law equally.

The authors find that

the default risk premium and sovereign bond segmentation effect appear to have been the dominant channels through which the SMP and the OMT affected sovereign bond yields of Italy and Spain. Redenomination risk may have been present at times and it may have been a third policy channel for the SMP and OMT in the case of Spain and Portugal, but not for Italy. … default risk accounts for 30% of the fall in yields across SMP and OMT for Italy. Segmentation accounts for the other 70%. For Spain, the numbers are 42% (default risk), 15% (redenomination risk) and 43% (segmentation). For Portugal, the numbers are 40% (default risk), 24% (redenomination risk) and 36% (segmentation). For the LTROs, we find that their effect on Spanish bond yields worked almost entirely via the sovereign segmentation channel. We show that the more substantial impact of the LTROs on Spanish sovereign yields than on Italian and Portuguese sovereign yields is consistent with Spanish banks purchasing a larger fraction of outstanding sovereign debt in the months following the introduction of the LTROs.

Redistribution From Unexpected Deflation in the Euro Area

In the JEEA 14(4) (August 2016) Klaus Adam and Junyi Zhu argue that

unexpected price-level movements generate sizable wealth redistribution in the Euro Area (EA) … The EA as a whole is a net loser of unexpected price-level decreases, with Italy, Greece, Portugal, and Spain losing most in per capita terms, and Belgium and Malta being net winners. Governments are net losers of deflation, while the household (HH) sector is a net winner … HHs in Belgium, Ireland, Malta, and Germany experience the biggest per capita gains, while HHs in Finland and Spain turn out to be net losers. … relatively young middle class HHs are net losers of deflation, while older and richer HHs are winners. … wealth inequality in the EA increases with unexpected deflation, although in some countries (Austria, Germany, and Malta) inequality decreases due to the presence of relatively few young borrowing HHs. … HHs in high-inflation EA countries hold… systematically lower nominal exposures.

The table reports the estimated effects of a one-time unexpected change in the general price level by 10% (expressed either in thousand EUR per capita, or as a share of GDP); a positive sign indicates a gain from deflation.

Government
(1000 EUR p.c.)
Households
(1000 EUR p.c.)
ROW
(1000 EUR p.c.)
Government
(share of GDP)
Households
(share of GDP)
ROW
(share of GDP)
Euro Area−18.67.810.8−0.730.300.42
Austria−21.711.610.1−0.700.370.32
Belgium−27.640.8−13.2−0.931.37−0.44
Cyprus−9.9−7.217.0−0.52−0.380.89
Finland−3.0−8.411.3−0.10−0.270.37
France−22.310.611.7−0.810.390.43
Germany−17.415.32.2−0.600.530.08
Greece−22.9−1.224.1−1.34−0.071.41
Ireland−19.221.8−2.6−0.540.61−0.07
Italy−23.28.115.1−0.990.350.64
Luxembourg22.712.0−34.70.350.18−0.53
Malta−8.320.1−11.8−0.631.52−0.89
Netherlands−16.5−9.525.9−0.50−0.290.78
Portugal−13.1−0.213.3−0.88−0.010.89
Slovakia−4.82.22.6−0.540.240.29
Slovenia−8.62.95.7−0.560.190.37
Spain−12.4−6.719.1−0.60−0.320.93

Greek Debt: Now and Then

In the FT, Mehreen Khan offers a “Greek debt dilemma cheat sheet.”

  • Face value: EUR 321 billion, thereof EUR 248 billion owed to official creditors.
  • Official creditors: Eurozone countries (Greek loan facility), eurozone rescue funds (EFSF and ESM), IMF, ECB.
  • Maturity profile:
    1
  • IMF proposal for restructuring:
    2

Cochrane for Growth

In a blog post, John Cochrane proposes step-by-step (politically unattractive) measures to increase growth:

  • Smarter (growth-oriented) regulation, in particular
  • Higher equity requirements and less short-term funding rather than complex financial regulation
  • Deregulation of health care supply
  • More cost-benefit analysis in environmental policy
  • Broad-based consumption rather than investment taxes
  • Clear separation of allocative and distributive fiscal policy
  • Focus on distortions in social programs
  • Deregulation of labor markets
  • Rational immigration rules distinguishing between permits to entry, reside, or work and citizenship
  • Less government intervention in the student loans market
  • Less protection, more free trade
  • More spending for the legal and criminal justice system
  • Etc.

Good and Bad Reasons for Greek Debt Relief

In a Vox column, William Cline argues that

it is important to recognise that the headline debt figure overstates the true burden of Greek debt. Because most of the debt is owed to official sector partners at concessional interest rates, the interest burden is much lower than would usually be associated with the same gross debt. Under the Fund’s own criterion for sustainability in these circumstances (ratio of gross financing needs to GDP), Greek debt should remain within an acceptable range at least through 2030. It is questionable to base debt relief policy on problems that might or might not materialise beyond such a distant horizon. Moreover, most of the projected sharp increase in debt could be avoided by carrying out bank recapitalisation directly from the European Stability Mechanism (ESM) to the banks, rather than through the Greek government as an intermediary.

There is still an important potential role for using interest rate relief, for two purposes. First, if fiscal balances fall below target because of lower than expected growth (rather than policy slippage), a portion of interest otherwise accruing could be forgiven to avoid the need for additional fiscal tightening and its recession-aggravating consequences. Second, because Greek unemployment is at depression levels (26%), special employment programmes would seem appropriate, and forgiving a portion of the interest due could provide a significant source of funding for this purpose.

Cline also discusses the claim that Eurozone loans mainly saved Eurozone banks:

  • not true, they received only one-third of the official sector support;

that the Troika called for too much austerity:

  • true, the cyclically adjusted primary balance swung from -13.2% of GDP in 2009 to +5.3% in 2014, much more than in Portugal, Spain or Ireland;
  • but Greece was cut off from financial markets;
  • and Eurozone support as a share of GDP exceeded 100% in Greece compared with roughly 30% in Ireland and Portugal or 5% when the US supported Mexico;
  • “even at the upper bound of the IMF’s upward-revised multipliers (1.7), smaller spending cuts would not have boosted GDP and revenue by enough to pay for themselves;”
  • and the adjustment mostly occurred in the early years when spreads were high and would have been even higher with less adjustment.

Cline estimates that the third rescue package will raise Greek net debt by 10-15 billion Euros.

Greece’s Financial Position Is Widely Misreported

In an FT letter to the editor, Ian Ball, the Chair of CIPFA International (Chartered Institute of Public Finance and Accountancy), argues that Greece’s financial position is widely misreported. He writes:

While the debt burden is commonly cited as being between 175 and 180 per cent of gross domestic product, this number is incorrect and indefensible because it is based on the face value of Greece’s debt that doesn’t take into account long maturities and concessional interest rates, as well as grace periods.

Greek debt, calculated on an International Public Sector Accounting Standards (IPSAS) basis, is significantly lower, and at the end of 2013 was 68 per cent of GDP. If this is not an appropriate method for measuring debt, then every company on major stock exchanges around the world has got its debt measurement wrong. In neither accounting standards nor economic principle is debt measured at face value. This pervasive misunderstanding of Greece’s real fiscal position has seen agreements reached between Greece and its creditors that do not address the real problem and instead may actually intensify it.

See also my earlier blog post.

Accounting for Sovereign Debt—Greece’s (Low) Debt Quota

An interesting conference organized by CESifo and Japonica Partners brought together accountants, lawyers and economists with interests in public finance and sovereign debt. Discussions about Greece took center stage.

According to estimates based on the accounting standards IPSAS, ESA 2010 or SNA 2008, Greece’s gross government debt quota at the end of 2013 amounted to roughly 70% and its net debt quota didn’t exceed 20%. The debt numbers give the present values of the contractual payments, discounted at the market yields at the time the debt was issued or restructured. The estimate of the gross debt position closely resembles estimates of the market value of Greek government debt by economists.

The claim that Greece urgently needs debt relief received only limited support, and least from people who worked for and with the Greek government. My reading was that any need for near term debt relief is mostly of a political nature.

Some relevant links:

  • Georgetown’s Anna Gelpern.
  • Duke’s Mitu Gulati.
  • IFAC, CIPFA.
  • The Reckoning: Financial Accountability and the Rise and Fall of Nations” by Jacob Soll.
  • Japonica Partners.
  • IPSAS: IFAC page, Wikipedia, slides with background info and examples, comparison with GFS (see p. 11).
  • Chicago Fed Mark Wright’s “The Stock of External Sovereign Debt: Can We Take the Data at ‘Face Value’?
  • European System of National and Regional Accounts in the European Union (ESA 2010), Chapter 20 (Government accounts):

    20.221: Debt operations can be particularly important for the general government sector, as they often serve as a means for government to provide economic aid to other units. The recording of these operations is covered in chapter 5. The general principle for any cancellation or assumption of debt of a unit by another unit, by mutual agreement is to recognise that there is a voluntary transfer of wealth between the two units. This means that the counterpart transaction of the liability assumed or of the claim cancelled is a capital transfer. No flow of money is usually observed, this may be characterised as a capital transfer in kind.

    20.236: Debt restructuring is an agreement to alter the terms and conditions for servicing an existing debt, usually on more favourable terms for the debtor. The debt instrument that is being restructured is considered to be extinguished and replaced by a new debt instrument with the new terms and conditions. If there is a difference in value between the extinguished debt instrument and the new debt instrument, it is a type of debt cancellation and a capital transfer is necessary to account for the difference.

  • UN, EC, OECD, IMF and World Bank System of National Accounts (2008 SNA):

    22.109–110: Debt rescheduling (or refinancing) is an agreement to alter the terms and conditions for servicing an existing debt, usually on more favourable terms for the debtor. Debt rescheduling involves rearrangements on the same type of instrument, with the same principal value and the same creditor as with the old debt. Refinancing entails a different debt instrument, generally at a different value and may be with a creditor different than that from the old debt. Under both arrangements, the debt instrument that is being rescheduled is considered to be extinguished and replaced by a new debt instrument with the new terms and conditions. If there is a difference in value between the extinguished debt instrument and the new debt instrument, part is a type of debt forgiveness by government and a capital transfer is necessary to account for the difference.

The European Court of Justice’s Verdict on OMT

The court ruled (full text) that

[t]his programme for the purchase of government bonds on secondary markets does not exceed the powers of the ECB in relation to monetary policy and does not contravene the prohibition of monetary financing of Member States. …

The Court finds that the OMT programme, in view of its objectives and the instruments provided for achieving them, falls within monetary policy and therefore within the powers of the ESCB. …

The Court also states that the OMT programme does not infringe the principle of proportionality. …

The Court states that this prohibition does not prevent the ESCB from adopting a programme such as the OMT programme and implementing it under conditions which do not result in the ESCB’s intervention having an effect equivalent to that of a direct purchase of government bonds from the public authorities and bodies of the Member States.

Claire Jones reports in the FT.

It is now up to the German Bundesverfassungsgericht to consider the ruling. The German court’s previous considerations can be found here.


Wealth Inequality, Theory and Measurement

In an NBER working paper, David Weil argues that Thomas Piketty overestimates wealth inequality. In the abstract of the paper, Weil writes:

In Capital in the 21st Century, Thomas Piketty uses the market value of tradeable assets to measure both productive capital and wealth. As a measure of wealth this is problematic because it ignores the value of human capital and transfer wealth, which have grown enormously over the last 300 years. Thus the constancy of the wealth/income ratio as portrayed in his data is an illusion. Further, the types of wealth that he does not measure are more equally distributed than tradeable assets. The approach also incorrectly identifies capital gains due to reduced discount rates as increases in the capital stock.


Fed and Treasury Maturity Policies

In a recent paper, Robin Greenwood, Sam Hanson, Josh Rudolph and Larry Summers discuss the joint effect of Fed and Treasury policy on the maturity structure of government liabilities in the hands of the private sector. John Cochrane commends the paper in a blog post.

Greenwood, Hanson, Rudolph and Summers make several points. First, “monetary and fiscal policies have been pushing in opposite directions in recent years.” In spite of QE, long-term government debt held by the private sector increased, mostly due to government deficits but also because the government lengthened the maturity of its debt. Second, Fed and Treasury policies largely are uncoordinated. They argue that this is suboptimal, in particular when the Fed strongly intervenes as it did in the recent QE episodes.

The Federal Reserve has focused purely on the effects that its bond purchases were expected to have on long-term interest rates and, by extension, the economy more broadly. … it completely ignored any possible impact on government fiscal risk, even though the Federal Reserve’s profits and losses are remitted to the Treasury. Conversely, Treasury’s debt management announcements and the advice of the Treasury Borrowing Advisory Committee (TBAC) have focused on the assumed benefits of extending the average debt maturity from a fiscal risk perspective, and largely ignored the impact of policy changes on long-term yields. To the extent that the Federal Reserve and Treasury ever publicly mention the other institution’s mandate, it is usually in the context of avoiding the perception that one institution might be helping the other achieve an objective. Specifically, the Fed does not want to be seen as monetizing deficits, while the Treasury has been reluctant to acknowledge the Fed as anything more than a large investor.

Third, they argue that from a consolidated government policy perspective, the optimal debt maturity structure is rather short. This saves on interest payments to the private sector (on average) and reduces “liquidity transformation” by the financial sector with dangerous consequences for financial stability. They downplay the risk sharing benefits of longer-term debt and argue that short-term debt has additional advantages at the zero lower bound.

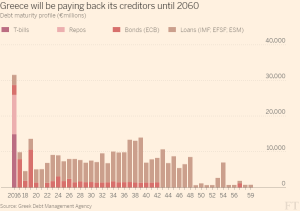
Pages 11-12 contain the following figure, among others:

11

Government, Household and Corporate Debt in the Euro Area

The Economist reviews developments on the debt front:

Between 2007 and 2013 the ratio of government debt to GDP in the euro area rose from 66% to 93%. The spike was more dramatic in the periphery (see chart): in Greece the ratio increased to 175% and in Portugal it virtually doubled to 129%.

The figure in the article shows debt quotas in six countries between 2007 and 2013. The article continues:

Despite Italy’s staggering government debt, its households owe less than Germany’s and its non-financial companies not much more. Spain’s private sector has deleveraged substantially over the past few years, as big recapitalisations have left its banks better able to withstand write-downs of bad loans.

One conclusion put forward is that governments will not be able to reduce debt quotas in the foreseeable future to the levels before the financial crisis.